线粒体比例过高可能意味着细胞处于凋亡状态,因此在单细胞数据分析中,通常会有一步过滤。最简单的操作就是,直接看小提琴图,手动选个阈值,过滤即可。
当然,更加高级一点的做法是,找离群的细胞进行过滤,比如说下面这种
Specifically, we fit the expression level of mitochondrial genes by using a median-centered median absolute deviation (MAD)-variance normal distribution, and then removed the cells with significantly higher expression levels than expected (determined by Benjamini-Hochberg corrected p < 0.01, for CD3+ dataset: 11.13%; for CD45+ dataset: 13.33%) (Pijuan-Sala et al., 2019).
Luoma, A.M., Suo, S., Williams, H.L., Sharova, T., Sullivan, K., Manos, M., Bowling, P., Hodi, F.S., Rahma, O., Sullivan, R.J., et al. (2020). Molecular pathways of colon inflammation induced by cancer immunotherapy. Cell 182, 655–671.e22. https://doi.org/10.1016/j.cell.2020.06.001.
Quality control: Cell libraries with low complexity (fewer than 1,000 expressed genes) were excluded. Cells with mitochondrial gene-expression fractions greater than 2.37%, 2.18%, and 3.35% for each of the wild-type atlas, _Tal1_−/− chimaeras, and wild-type chimaeras, respectively, were excluded. The thresholds were determined by considering a median-centred median absolute deviation (MAD)-variance normal distribution; cells with mitochondrial read fraction outside of the upper end of this distribution were excluded (where outside corresponds to P < 0.05; Benjamini–Hochberg-corrected).
Pijuan-Sala, B., Griffiths, J.A., Guibentif, C., Hiscock, T.W., Jawaid, W., Calero-Nieto, F.J., Mulas, C., Ibarra-Soria, X., Tyser, R.C.V., Ho, D.L.L., et al. (2019). A single-cell molecular map of mouse gastrulation and early organogenesis. Nature 566, 490–495. https://doi.org/10.1038/s41586-019-0933-9.
上述过滤分为两个部分,第一个部分是将数据拟合到正态分布中,第二个部分是基于正态分布计算每个值出现的概率(经过多重检验),然后筛选出不太可能出现的细胞。
这里有一个专业术语,“Median-centred median absolute deviation (MAD)-variance normal distribution”,主要在统计学和数据分析中使用,特别是在处理有离群值的数据集时。这个术语可以分解为几个关键组成部分来理解:
- 中位数中心化(Median-centred):这意味着数据的中心(或比较的基点)是数据集的中位数,而不是平均值。中位数是将数据集从小到大排序后位于中间的值。如果数据集的数量是偶数,则中位数是中间两个数的平均值。中位数中心化有助于减少极端值对数据分析的影响,因为中位数对离群值不如平均值那么敏感。
- 中位数绝对偏差(Median Absolute Deviation, MAD):MAD是一种衡量数据集变异性的方法,它计算的是各数据点与数据集中位数的绝对偏差的中位数。与标准偏差相比,MAD对离群值的影响较小,因此是一种更鲁棒的变异性度量。
- MAD-方差正态分布:这部分描述了使用MAD来标准化数据的过程,使得标准化后的数据有着类似于正态分布的性质,即均值为0,方差为1。在实践中,这通常通过从每个数据点中减去中位数,然后除以MAD来实现。为了使得标准化后的数据与标准正态分布的方差对齐,可能还需要乘以一个常数(如1.4826,这个值是在假设原始数据是正态分布的情况下推导出的)。
有了这些基本知识后,我们可以写一个代码进行实现
import numpy as np
import scipy.stats as stats
from statsmodels.stats.multitest import multipletests
import scanpy as sc

def mad_based_normalization(data, mad_constant =  1.4826):
    median = np.median(data)
    absolute_deviation = np.abs(data - median)
    mad = np.median(absolute_deviation)
    normalized_data = (data - median) / (mad * mad_constant)
    return normalized_data

def filter_cells_with_mitochondrial_fraction(mitochondrial_fraction, mad_constant = 1.4826, alpha=0.05):
    """
    根据线粒体读取比例排除细胞, 返回一个Bool列表,记录那些数据应该被保留

    :mitochondrial_fraction 线粒体占比
    :param alpha: 显著性水平阈值。
    :return: of List of Bool for cell to keep
    """
    # 计算每个细胞的线粒体基因表达比例

    # 对线粒体读取比例应用MAD基于中位数的标准化
    normalized_mitochondrial_fraction = mad_based_normalization(mitochondrial_fraction, mad_constant)

    # 计算z分数
    z_scores = normalized_mitochondrial_fraction

    # 计算P值
    p_values = stats.norm.sf(z_scores)  # 一尾检验

    # 应用Benjamini-Hochberg校正
    _, corrected_p_values, _, _ = multipletests(p_values, alpha=alpha, method='fdr_bh')

    # 保留 >= alpha的结果
    filtered_cells = corrected_p_values >= alpha

    return filtered_cells
使用方法如下,从adata中提取线粒体比例这一列,然后调用函数获取保留的细胞,并对原始数据进行过滤
percent_mt = adata.obs['pct_counts_mt'].copy()
keep_cell = filter_cells_with_mitochondrial_fraction(percent_mt)
adata.obs['keep_mito'] = ['keep' if keep else 'filter' for keep in keep_cell]
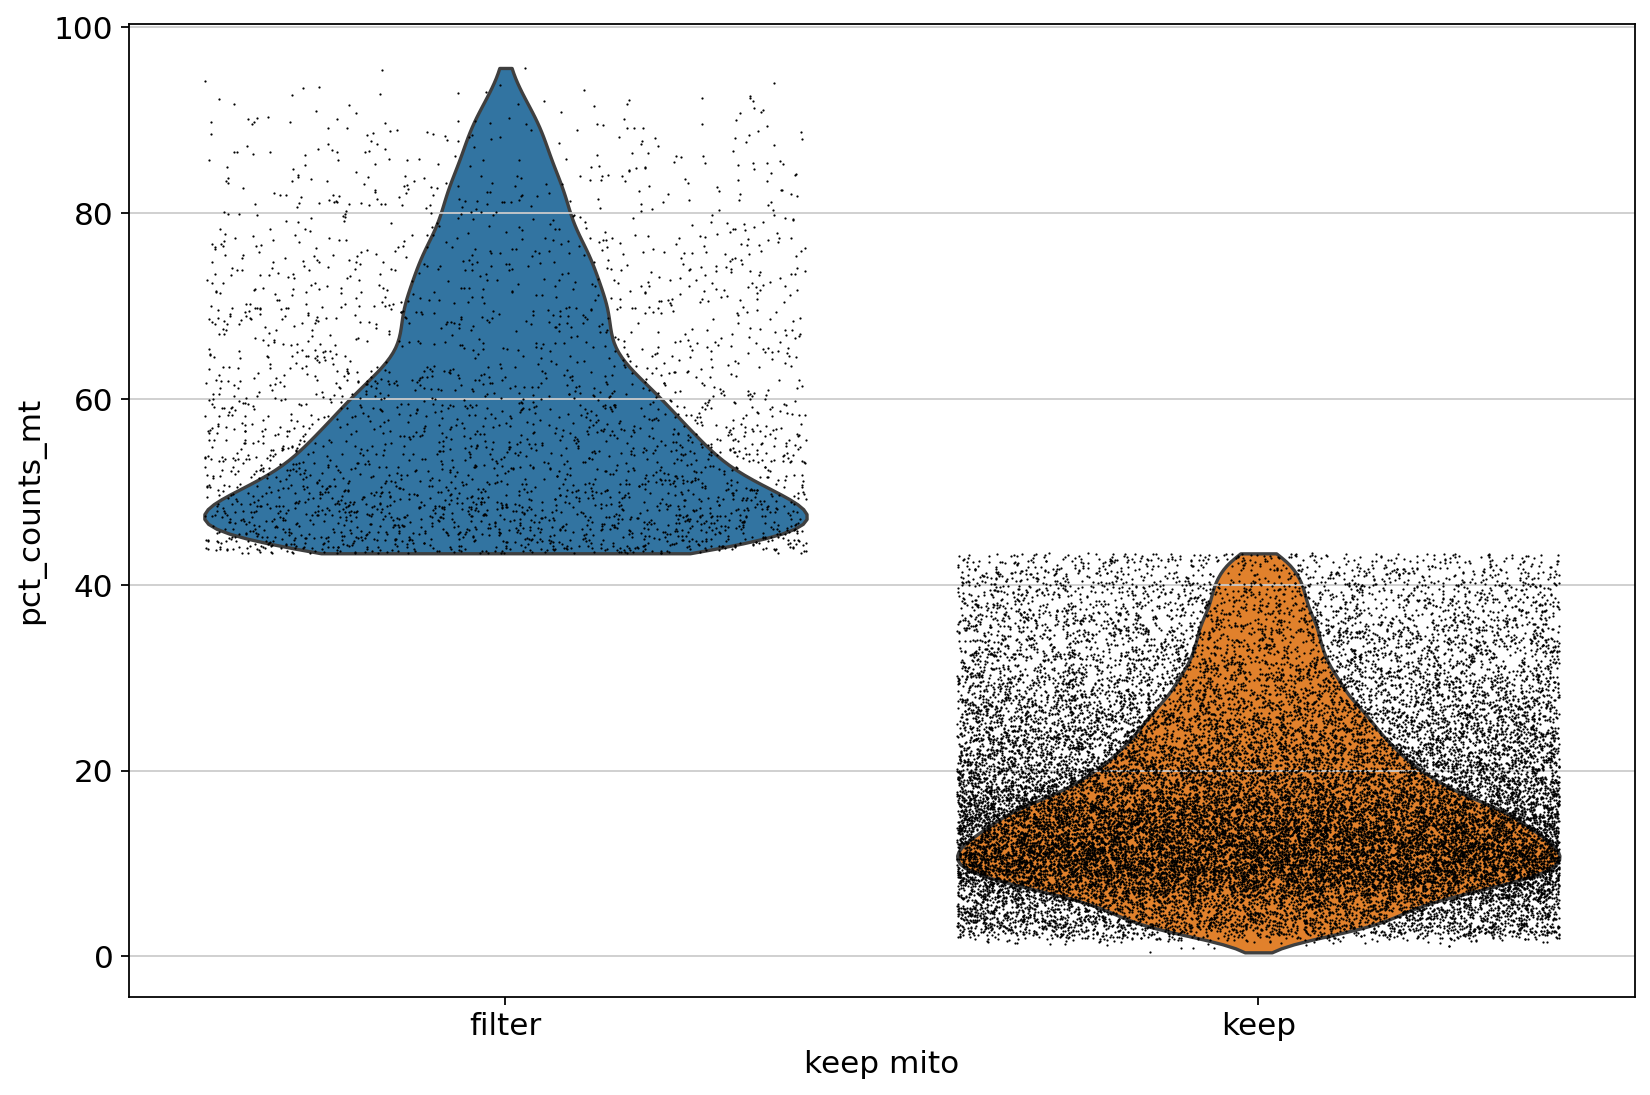
# 可视化
ax = sc.pl.violin(adata_sub, ['pct_counts_mt'], groupby="keep_mito", jitter=0.4)
类似于下图中这个效果,相当于动态确定了阈值,而不是一个固定阈值过滤。